

For the last seven or eight years, I have been in sore need of an insights tool to report the general health of websites to clients. The idea of getting such a tool has taken dozens of forms over that time, to the point where I felt that it was never going to happen. Most of the time, it never got past the stage of being an idea. For the last three years, I’ve resorted to a Microsoft Word document that would do the job, but managing new versions and data sets became a pain in the arse.
I always knew I needed a better system. Not just one where I could generate reports, but one where I could manage everything. One where I could add and remove data as needed. Where I could toggle certain data sets, depending on the client. A system like that would need to be custom-built and would take a lot of time, money or – more likely – both.
And then shit happened.
What started this?
Last year saw some changes in my reporting needs, most notably Google dropping support for their Universal Analytics platform in favour of GA4. That put me in a bind because I couldn’t report on SEO and analytics data without … you know … the analytics source. Admittedly, I should have spent time analysing what options I had with GA4 and started from there. But I didn’t, and that’s on me, and that left me to rebuild the Word document again.
Only, it didn’t. I started from scratch with a new system. And it was all thanks to a little project called Colour Library.
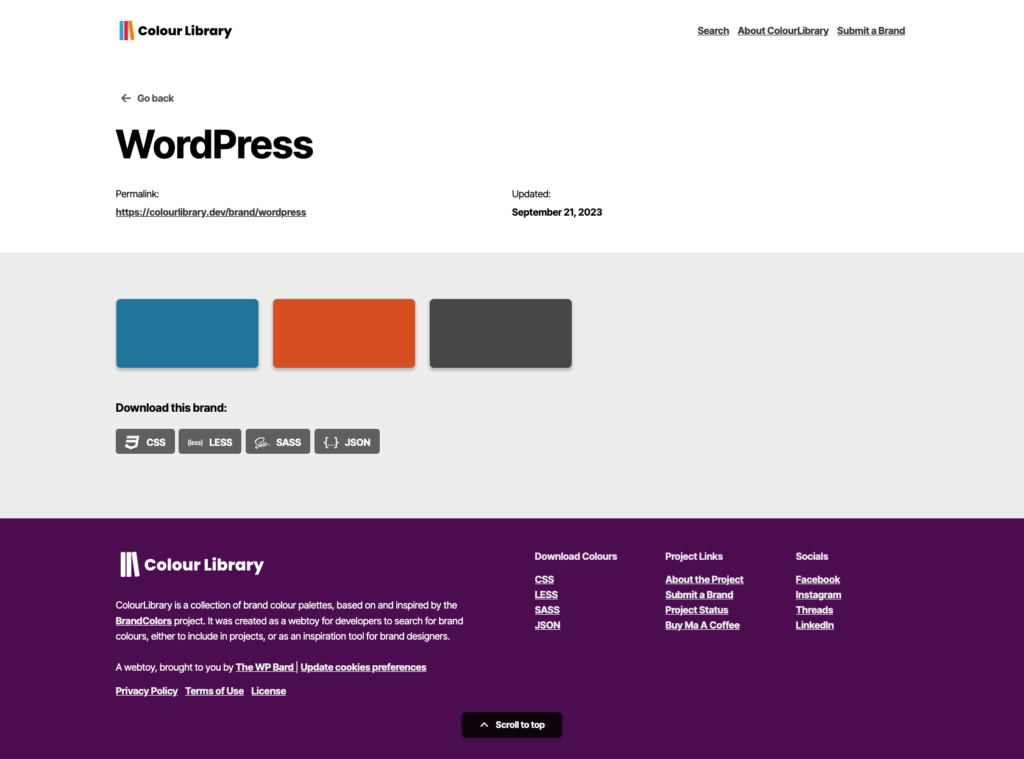
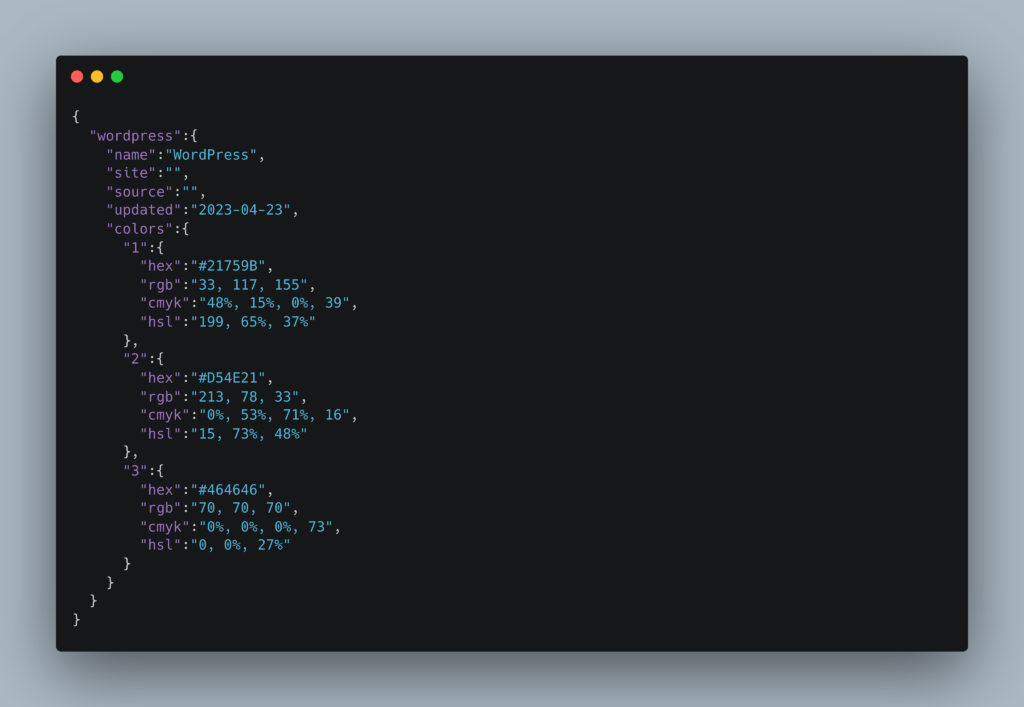
Like most content management systems on the web, Colour Library is a PHP and MySQL-powered system. It stores the data needed in a set of tables and calls the data required as and when it needs it. At the time of writing, there are 729 brands listed there (you can add more by submitting your entry here). While the idea for the project was based on the Brand Colors website, my version took a less visually attractive form at the start – a single JSON file.
From there, I created a series of mockups of how I wanted the app to look. I then built a prototype locally, worked out the MySQL kinks, added a CMS, and published it. It was great. I loved it. It worked. It did everything I wanted it to do.
And it all started with that one JSON file.
Chasing the JSON dream
So, I got to thinking. If I could encode hundreds of brands and their colour palettes as a single JSON file, what would stop me from encoding an entire report as one? It was a data set. A large one with more sections, sure. But it was still a data set. Surely it would work.
It did. I spent the better part of a day encoding a multiple-page document into JSON, but it worked. From there, it would be a matter of pulling the right data out and plugging it into the right placeholder. Just as I did with Colour Library, I had the basic foundation of my insights tool. Now, I had a few things to do to make this work:
First of all, I had to make the resulting report look good. That may not be the most important thing for most projects, especially a project like this. But if I couldn’t make the reports look good, there was no point in trying. So, I spent a little time looking at other systems I use, looked at similar templates, and mocked up some more designs.
I have to say, it looked gorgeous. Even as a prototype, with the dummy data set I had created in the JSON file, I was in love. Now, I had to get the data into that structure. For that, I had to look at the input and the database. Since I had already created the report with sections, it made sense to put those sections into the admin area.
I won’t go into details because you don’t need to know them. You could build such a system yourself if you were inclined to. But encoding the data into that JSON file helped no end. Within a month and a half, I had the barebones of the system ready.
It didn’t stop there.
As with every project I work on, there’s always that element of “It’d be cool if I could …”. And this was no exception. Basic client data became connected to my Hubspot CRM. Recording of invoices was added. System notes were added. Some data could even be collected via APIs and processed accordingly. I added a lot of data points – more than I added in my previous reports – and I still keep thinking that I got in way over my head.
There are a lot of things in there that I am proud of. But the one thing I added that I think works best is report versions. For me, if new data points are added, I just create a new report. I create the front and back-end elements, upload them, and I can select the version I need from the system. The system then pulls everything in for me. Which means I no longer need to worry if – or when – data sources change. The issues with Google Analytics are issues no more.
I spent two and a half months on this. I sat and coded and planned from the minute I woke up until the minute I went to bed. For two and a half months, I was testing and adding and removing chunks of code. Until in December, I sent out my first report to a client.
What was the point of this?
I needed the system, so I built the system. That’s the long and short of it. I could try to make this more prosaic, but I needed the system. It was important that I could do this and manage everything in a way that worked for me. And I think I did that. And I think I did a bloody good job of it.
But, in making this system, I learned other things. Some things that I needed to learn, and things I’m still learning. The two biggest lessons would be these:
Start. Start anywhere, but start.
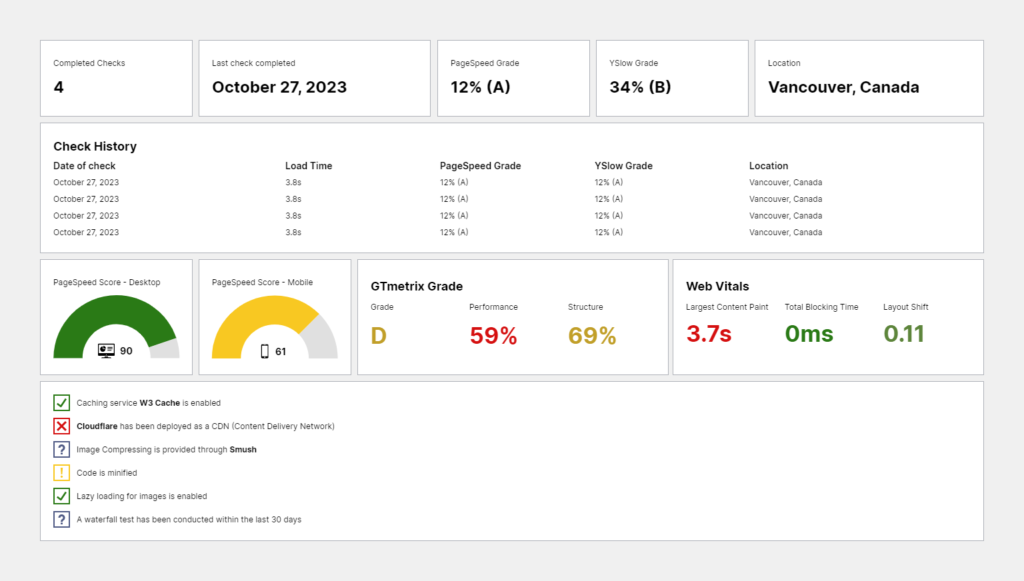
Had I not created Colour Library, I don’t think the insights system would be up and running so quickly. That JSON file was the spark I needed in both projects. And both projects are working better than I expected them to be. That foundation meant I could add more, and I have added so much more. I integrated uptime monitors from Better Stacks, vulnerability checks from the WordPress Vulnerability Database, Google PageSpeed results, WHOIS API checks, and all via APIs or datasets downloaded from them. But I couldn’t have added them if it wasn’t for that JSON file.
If you’re ever going to work on something, regardless of the size or nature of the project, start.
“Not perfect” is still good enough.
There’s more that I want to add. Of course there is. There are things I really should add, and I can. But I am also chuffed to bits with what I have now. It works. I can make it work better, and I probably will. But what I have now works, and it does everything I want it to. And that is good enough. It has to be sometimes. You could spend hours working on a small element of your project, trying to make it perfect. But sometimes, “not perfect” is still good enough.